Note
Go to the end to download the full example code.
Single-Channel Image
In fluorescence imaging, we work with single-channel images. A single channel image simply means that each pixel has a single intensity value. In fluorescence images, each value represents how much light (or fluorescence) was detected at that point. This website gives a very good simple explanation on how the light detected is transformed into pixels.
Grayscale
A single channel image is also often referred to as a grayscale image. A grayscale image simply maps the intensity values to shades of gray—from black (0 intensity) to white (maximum intensity).
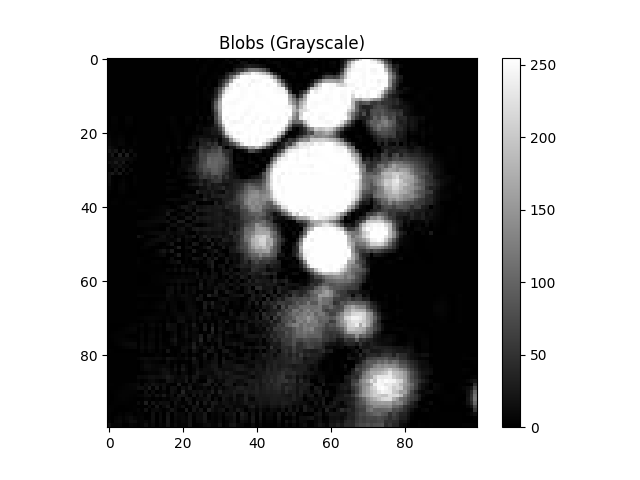
As an example, we will use this 100 × 100 pixel image, blobs.jpeg, which shows, well, blobs. This image actually shows a magnified view of lipid droplets in HeLa cells that I extracted from this image.
from PIL import Image
import numpy as np
import matplotlib.pyplot as plt

# Open the image and convert it to a NumPy array
blobs = Image.open("images/blobs.jpeg")
blobs = np.array(blobs)

plt.figure()
plt.imshow(blobs, cmap='gray')
plt.colorbar()  # Add a color scale bar to see the intensity range
plt.title("Blobs (Grayscale)")
plt.show()

In this grayscale representation, every pixel’s value is mapped onto a scale from black to white. Black pixels have the lowest intensity, and white pixels have the highest intensity. Intermediate values appear as different shades of gray.
Other Representations of Single-Channel Images
We can also replace the generally used grayscale gradient with a different color gradient (colormap).
plt.figure(figsize=(17,3.8))

plt.subplot(141)
plt.title("Blobs (binary)")
plt.imshow(blobs, cmap='binary')
plt.colorbar()

plt.subplot(142)
plt.title("Blobs (Blues)")
plt.imshow(blobs, cmap='Blues')
plt.colorbar()

plt.subplot(143)
plt.title("Blobs (viridis)")
plt.imshow(blobs, cmap='viridis')
plt.colorbar()

plt.subplot(144)
plt.title("Blobs (jet)")
plt.imshow(blobs, cmap='jet')
plt.colorbar()

plt.tight_layout()
plt.show()

As you can see, not only can we assign different values to different colors, but the general rule that a larger value means a brighter pixel and a smaller value means a darker pixel also doesn’t really apply to the above image representations.
In this case, the image can also be thought of as a heatmap. This is often the case with scientific images. Because the regular grayscale gradient cannot always represent the information we want to show from an image data.
So it is up to the researchers to pick the appropriate representation.
Total running time of the script: (0 minutes 0.486 seconds)