Note
Go to the end to download the full example code.
Binary Image
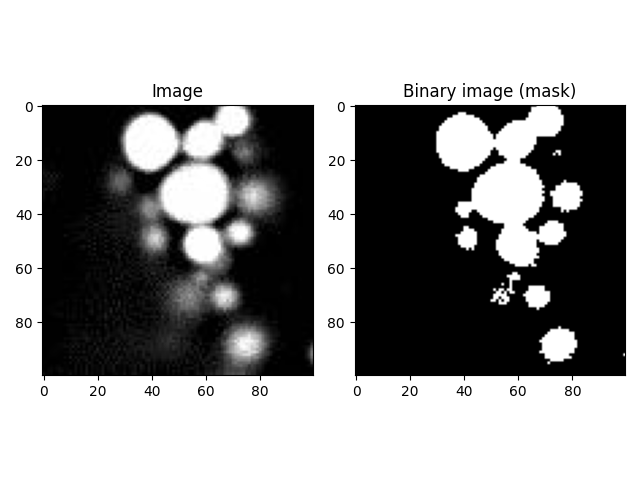
Previously, we learned that defining a threshold value can help identify the signal in an image. The result of this can be represented by a binary image.
You can think of a binary image as a map showing where the objects of interest are located.
Pixels belonging to the signal become True (or 1), and pixels belonging to the background become False (or 0).
Let’s create a binary image from our example blobs.jpeg by applying Otsu’s thresholding method:
from PIL import Image
import numpy as np
import matplotlib.pyplot as plt

from skimage.filters import threshold_otsu

blobs = Image.open("images/blobs.jpeg")
blobs = np.array(blobs)

th_otsu = threshold_otsu(blobs)
bin_image = blobs > th_otsu

plt.figure()

plt.subplot(121)
plt.title('Image')
plt.imshow(blobs, cmap='gray')

plt.subplot(122)
plt.title('Binary image (mask)')
plt.imshow(bin_image, cmap='gray')

plt.tight_layout()
plt.show()

It’s called “binary” because it contains only two values — (1 and 0)
or (True and False) — corresponding to the pixels we want
(shown in white) and the pixels that we don’t want (shown in black),
respectively.
print(f'unique values of original image: {np.unique(blobs)}')
print(f'unique values of binary image: {np.unique(bin_image)}')
unique values of original image: [  0   1   2   3   4   5   6   7   8   9  10  11  12  13  14  15  16  17
  18  19  20  21  22  23  24  25  26  27  28  29  30  31  32  33  34  35
  36  37  38  39  40  41  42  43  44  45  46  47  48  49  50  51  52  53
  54  55  56  57  58  59  60  61  62  63  64  65  66  67  68  69  70  71
  72  73  74  75  76  77  78  79  80  81  82  83  84  85  86  87  88  89
  90  91  92  93  94  95  96  97  98  99 100 101 102 103 104 105 106 107
 108 109 110 111 112 113 114 115 116 117 118 119 120 121 122 123 124 125
 126 127 128 129 130 131 132 133 134 135 136 137 138 139 140 141 142 143
 144 145 146 147 148 149 150 151 152 153 154 155 156 157 158 159 160 161
 162 163 164 165 166 167 168 169 170 171 172 173 174 175 176 177 178 179
 180 181 182 183 184 185 186 187 188 189 190 191 192 193 194 195 196 197
 198 199 200 201 202 203 204 205 206 207 208 209 210 211 212 213 214 215
 216 217 218 219 220 221 222 223 224 225 226 227 228 229 230 231 232 233
 234 235 236 237 238 239 240 241 242 243 244 245 246 247 248 249 250 251
 252 253 254 255]
unique values of binary image: [False  True]
The bin_image image above maps the location of signals, which is defined
by pixels with a value greater than the threshold blobs > th_otsu.
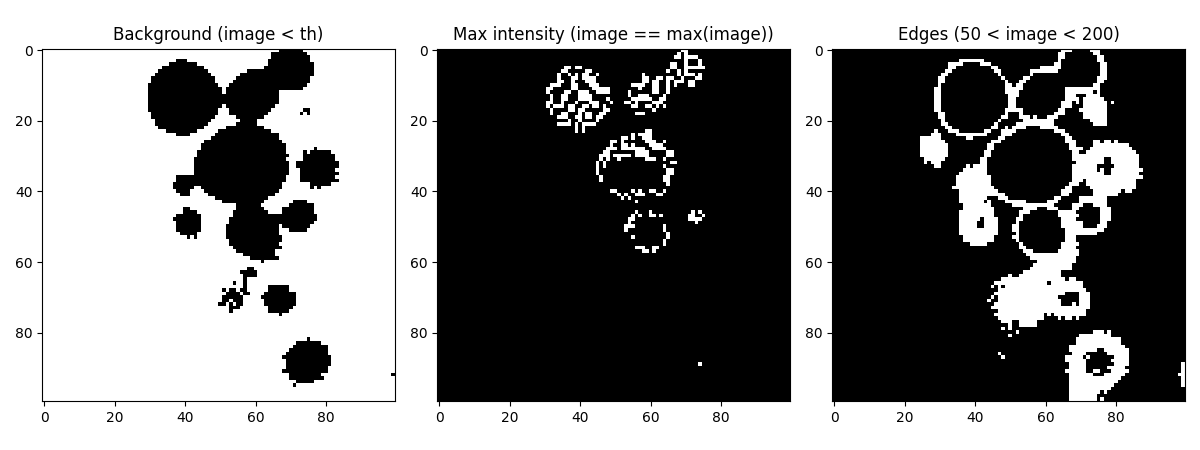
But we can make a binary image of any condition(s) that we want. For example, we can make binary images of:
Background, i.e. pixels that are lower than the threshold with
image < th.Pixels with maximum intensity with
image == max(image)Pixels with values in certain range (value 1 < image < value 2), can be defined as
(image > val_1) & (image < val_2)
# pixels lower than threshold
background = blobs < th_otsu

# pixels with maximum intensity
max_value = blobs == blobs.max()

# pixels with values in ceratin range
edges = (blobs > 50) & (blobs < 200)

plt.figure(figsize=(12,4.5))

plt.subplot(131)
plt.title("Background (image < th)")
plt.imshow(background, cmap='gray')

plt.subplot(132)
plt.title("Max intensity (image == max(image))")
plt.imshow(max_value, cmap='gray')

plt.subplot(133)
plt.title("Edges (50 < image < 200)")
plt.imshow(edges, cmap='gray')

plt.tight_layout()
plt.show()

Total running time of the script: (0 minutes 0.323 seconds)